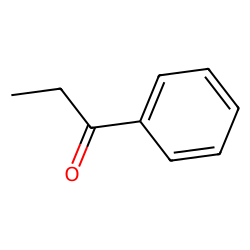
- InChI
- InChI=1S/C9H10O/c1-2-9(10)8-6-4-3-5-7-8/h3-7H,2H2,1H3
- InChI Key
- KRIOVPPHQSLHCZ-UHFFFAOYSA-N
- Formula
- C9H10O
- SMILES
- CCC(=O)c1ccccc1
- Molecular Weight1
- 134.18
- CAS
- 93-55-0
- Other Names
-
- 1-phenyl-1-propanone
- 1-phenylpropanone
- Ketone, ethyl phenyl
- NSC 16937
- Phenyl ethyl ketone
- USAF EK-1235
- ethyl phenyl ketone
- propionylbenzene
- propiophenone
- ω : Acentric Factor.
- PAff : Proton affinity (kJ/mol).
- BasG : Gas basicity (kJ/mol).
- ΔcH°liquid : Standard liquid enthalpy of combustion (kJ/mol).
- Cp,gas : Ideal gas heat capacity (J/mol×K).
- η : Dynamic viscosity (Pa×s).
- EA : Electron affinity (eV).
- ΔfG° : Standard Gibbs free energy of formation (kJ/mol).
- ΔfH°gas : Enthalpy of formation at standard conditions (kJ/mol).
- ΔfH°liquid : Liquid phase enthalpy of formation at standard conditions (kJ/mol).
- ΔfusH° : Enthalpy of fusion at standard conditions (kJ/mol).
- ΔvapH° : Enthalpy of vaporization at standard conditions (kJ/mol).
- ΔvapH : Enthalpy of vaporization at a given temperature (kJ/mol).
- IE : Ionization energy (eV).
- log10WS : Log10 of Water solubility in mol/l.
- logPoct/wat : Octanol/Water partition coefficient.
- McVol : McGowan's characteristic volume (ml/mol).
- Pc : Critical Pressure (kPa).
- Pvap : Vapor pressure (kPa).
- n0 : Refractive Index.
- ρl : Liquid Density (kg/m3).
- Inp : Non-polar retention indices.
- Ip : Polar retention indices.
- csound,fluid : Speed of sound in fluid (m/s).
- Tboil : Normal Boiling Point Temperature (K).
- Tc : Critical Temperature (K).
- Tfus : Normal melting (fusion) point (K).
- Vc : Critical Volume (m3/kmol).
- 1: Molecular weight from the IUPAC atomic weights tables.
Cheméo is a service of Céondo GmbH, since 2007, we provide simulation, modelling and software development services for the industry.
Do not hesitate to contact us for your projects.
Contents
- Physical Properties
- Temperature Dependent Properties
- Datasets
- Correlations
- Similar Compounds
- Mixtures
- Sources
Physical Properties
| Property | Value | Unit | Source |
|---|---|---|---|
| ω | 0.4177 | Relay (1.0) Calculated Property | |
| PAff | 867.40 | kJ/mol | NIST |
| BasG | 835.60 | kJ/mol | NIST |
| ΔcH°liquid | -4803.70 ± 1.00 | kJ/mol | NIST |
| EA | 0.35 ± 0.00 | eV | NIST |
| ΔfG° | 8.39 | kJ/mol | Joback Calculated Property |
| ΔfH°gas | -120.93 | kJ/mol | Relay (1.0) Calculated Property |
| ΔfH°liquid | -167.20 ± 1.30 | kJ/mol | NIST |
| ΔfusH° | 14.71 | kJ/mol | Joback Calculated Property |
| ΔvapH° | 60.17 | kJ/mol | Relay (1.0) Calculated Property |
| IE | [9.16; 9.27] | eV |

|
| IE | 9.16 | eV | NIST |
| IE | 9.27 ± 0.05 | eV | NIST |
| log10WS | -1.83 | Aq. Solubility Prediction | |
| logPoct/wat | 2.279 | Crippen Calculated Property | |
| McVol | 115.480 | ml/mol | McGowan Calculated Property |
| Pc | 3509.58 | kPa | Joback Calculated Property |
| Inp | [1140.00; 1188.60] |
|
|
| Inp | 1164.00 | NIST | |
| Inp | 1164.00 | NIST | |
| Inp | 1179.00 | NIST | |
| Inp | 1165.30 | NIST | |
| Inp | 1172.80 | NIST | |
| Inp | 1188.60 | NIST | |
| Inp | 1180.30 | NIST | |
| Inp | 1183.00 | NIST | |
| Inp | 1174.00 | NIST | |
| Inp | 1176.00 | NIST | |
| Inp | 1177.00 | NIST | |
| Inp | 1178.00 | NIST | |
| Inp | 1179.00 | NIST | |
| Inp | 1181.00 | NIST | |
| Inp | 1164.00 | NIST | |
| Inp | 1164.00 | NIST | |
| Inp | 1164.00 | NIST | |
| Inp | Outlier 1140.00 | NIST | |
| Inp | Outlier 1144.00 | NIST | |
| Inp | 1179.00 | NIST | |
| Inp | 1183.00 | NIST | |
| Ip | [1682.00; 1744.00] |
|
|
| Ip | 1734.00 | NIST | |
| Ip | 1682.00 | NIST | |
| Ip | 1744.00 | NIST | |
| Ip | 1696.00 | NIST | |
| Ip | 1737.00 | NIST | |
| Ip | 1712.00 | NIST | |
| Ip | 1734.00 | NIST | |
| Tboil | [471.15; 490.90] | K |
|
| Tboil | 490.70 | K | NIST |
| Tboil | 481.15 ± 10.00 | K | NIST |
| Tboil | 471.15 ± 10.00 | K | NIST |
| Tboil | 490.85 ± 1.00 | K | NIST |
| Tboil | 490.90 ± 0.50 | K | NIST |
| Tboil | 489.15 ± 2.00 | K | NIST |
| Tc | 700.54 | K | Relay (1.0) Calculated Property |
| Tfus | [288.15; 291.76] | K |
|
| Tfus | 291.45 | K | Jean-Claude Bradley Open Melting Point Dataset (2014, CC0) Compiled value |
| Tfus | 291.55 | K | Aq. Solubility Prediction |
| Tfus | 291.76 ± 0.05 | K | NIST |
| Tfus | 288.15 ± 1.50 | K | NIST |
| Vc | 0.426 | m3/kmol | Relay (1.0) Calculated Property |

Temperature Dependent Properties
| Property | Value | Unit | Temperature (K) | Source |
|---|---|---|---|---|
| ΔvapH | [44.40; 52.10] | kJ/mol | [422.50; 505.50] |
|
| ΔvapH | 44.40 | kJ/mol | 422.50 | NIST |
| ΔvapH | 52.10 | kJ/mol | 505.50 | NIST |
| n0 | [1.52450; 1.52450] | [298.15; 298.15] |
|
|
| n0 | 1.52450 | 298.15 | Excess Molar Volumes of (propiophenone + benzene, or toluene, or ethylbenzene, or butylbenzene) at temperatures 298.15 K and 328.15 K | |
| n0 | 1.52450 | 298.15 | Excess molar volumes of (propiophenone + toluene) and estimated density of liquid propiophenone below its melting temperature | |
| ρl | 1009.20 | kg/m3 | 298.15 | Ultrasonic Studies of Binary Mixtures of Some Aromatic Ketones with N-Methyl-acetamide at 308.15 K |
| csound,fluid | 1432.00 | m/s | 308.15 | Ultrasonic studies on binary mixtures of some aromatic ketones with acetonitrile at T = 308.15 K |
Datasets
Viscosity, Pa*s
| Fixed | Measured | |
|---|---|---|
| Temperature, K - Liquid | Pressure, kPa - Liquid | Viscosity, Pa*s - Liquid |
| 308.15 | 101.30 | 0.0015 |
| Reference | ||
Mass density, kg/m3
| Fixed | Measured | |
|---|---|---|
| Temperature, K - Liquid | Pressure, kPa - Liquid | Mass density, kg/m3 - Liquid |
| 298.15 | 100.00 | 1005.3 |
| 298.15 | 2130.00 | 1006.4 |
| 298.15 | 4150.00 | 1007.5 |
| 298.15 | 6180.00 | 1008.7 |
| 298.15 | 8210.00 | 1009.8 |
| 298.15 | 10230.00 | 1010.9 |
| 298.15 | 11250.00 | 1011.5 |
| 298.15 | 12260.00 | 1012.1 |
| 298.15 | 14290.00 | 1013.2 |
| 298.15 | 16310.00 | 1014.3 |
| 298.15 | 18340.00 | 1015.3 |
| 298.15 | 20370.00 | 1016.4 |
| 298.15 | 22390.00 | 1017.5 |
| 298.15 | 24420.00 | 1018.5 |
| 298.15 | 26450.00 | 1019.5 |
| 298.15 | 28470.00 | 1020.5 |
| 298.15 | 29490.00 | 1021.0 |
| 298.15 | 30500.00 | 1021.6 |
| 298.15 | 32530.00 | 1022.5 |
| 298.15 | 34550.00 | 1023.5 |
| 298.15 | 36580.00 | 1024.5 |
| 298.15 | 38600.00 | 1025.5 |
| 298.15 | 39620.00 | 1025.9 |
| 308.15 | 100.00 | 996.8 |
| 308.15 | 2130.00 | 998.0 |
| 308.15 | 4150.00 | 999.2 |
| 308.15 | 6180.00 | 1000.4 |
| 308.15 | 8210.00 | 1001.6 |
| 308.15 | 10230.00 | 1002.8 |
| 308.15 | 11250.00 | 1003.4 |
| 308.15 | 12260.00 | 1003.9 |
| 308.15 | 14290.00 | 1005.1 |
| 308.15 | 16310.00 | 1006.2 |
| 308.15 | 18340.00 | 1007.3 |
| 308.15 | 20370.00 | 1008.4 |
| 308.15 | 22390.00 | 1009.5 |
| 308.15 | 24420.00 | 1010.6 |
| 308.15 | 26450.00 | 1011.7 |
| 308.15 | 28470.00 | 1012.8 |
| 308.15 | 29490.00 | 1013.2 |
| 308.15 | 30500.00 | 1013.8 |
| 308.15 | 32530.00 | 1014.8 |
| 308.15 | 34550.00 | 1015.8 |
| 308.15 | 36580.00 | 1016.8 |
| 308.15 | 38600.00 | 1017.9 |
| 308.15 | 39620.00 | 1018.3 |
| 318.15 | 100.00 | 988.3 |
| 318.15 | 2130.00 | 989.6 |
| 318.15 | 4150.00 | 990.9 |
| 318.15 | 6180.00 | 992.1 |
| 318.15 | 8210.00 | 993.3 |
| 318.15 | 10230.00 | 994.6 |
| 318.15 | 11250.00 | 995.2 |
| 318.15 | 12260.00 | 995.8 |
| 318.15 | 14290.00 | 997.0 |
| 318.15 | 16310.00 | 998.1 |
| 318.15 | 18340.00 | 999.3 |
| 318.15 | 20370.00 | 1000.4 |
| 318.15 | 22390.00 | 1001.6 |
| 318.15 | 24420.00 | 1002.7 |
| 318.15 | 26450.00 | 1003.8 |
| 318.15 | 28470.00 | 1004.9 |
| 318.15 | 29490.00 | 1005.5 |
| 318.15 | 30500.00 | 1006.0 |
| 318.15 | 32530.00 | 1007.1 |
| 318.15 | 34550.00 | 1008.2 |
| 318.15 | 36580.00 | 1009.2 |
| 318.15 | 38600.00 | 1010.3 |
| 318.15 | 39620.00 | 1010.8 |
| 328.15 | 100.00 | 979.6 |
| 328.15 | 2130.00 | 981.1 |
| 328.15 | 4150.00 | 982.4 |
| 328.15 | 6180.00 | 983.7 |
| 328.15 | 8210.00 | 985.0 |
| 328.15 | 10230.00 | 986.2 |
| 328.15 | 11250.00 | 986.9 |
| 328.15 | 12260.00 | 987.5 |
| 328.15 | 14290.00 | 988.7 |
| 328.15 | 16310.00 | 990.0 |
| 328.15 | 18340.00 | 991.2 |
| 328.15 | 20370.00 | 992.3 |
| 328.15 | 22390.00 | 993.5 |
| 328.15 | 24420.00 | 994.7 |
| 328.15 | 26450.00 | 995.9 |
| 328.15 | 28470.00 | 997.1 |
| 328.15 | 29490.00 | 997.6 |
| 328.15 | 30500.00 | 998.2 |
| 328.15 | 32530.00 | 999.3 |
| 328.15 | 34550.00 | 1000.4 |
| 328.15 | 36580.00 | 1001.5 |
| 328.15 | 38600.00 | 1002.6 |
| 328.15 | 39620.00 | 1003.2 |
| Reference | ||
Correlations
| Property | Value | Unit | Temperature (K) | Source |
|---|---|---|---|---|
| Cp,gas | [140.07; 354.14] | J/mol×K | [273.00; 1000.00] |
Joback Predicted correlation
|
| Equation | Y = A + B·T + C·T² + D·T³ + E·T⁴ Y is Cp,gas in J/mol×K, T in K | |||
| Coefficient A | -3.18390e+01 | |||
| Coefficient B | 7.51920e-01 | |||
| Coefficient C | -4.78300e-04 | |||
| Coefficient D | 1.12360e-07 | |||
| Coefficient E | 0.00000e+00 | |||
| Temperature range, min. | 273.00 | |||
| Temperature range, max. | 1000.00 | |||
| Cp,gas | 140.07 | J/mol×K | 273.00 | Calculated Property |
| Cp,gas | 179.29 | J/mol×K | 353.78 | Calculated Property |
| Cp,gas | 213.81 | J/mol×K | 434.56 | Calculated Property |
| Cp,gas | 244.01 | J/mol×K | 515.33 | Calculated Property |
| Cp,gas | 270.23 | J/mol×K | 596.11 | Calculated Property |
| Cp,gas | 292.83 | J/mol×K | 676.89 | Calculated Property |
| Cp,gas | 312.16 | J/mol×K | 757.67 | Calculated Property |
| Cp,gas | 328.59 | J/mol×K | 838.44 | Calculated Property |
| Cp,gas | 342.47 | J/mol×K | 919.22 | Calculated Property |
| Cp,gas | 354.14 | J/mol×K | 1000.00 | Calculated Property |
| Property | Value | Unit | Temperature (K) | Source |
|---|---|---|---|---|
| η | [0.0019806; 0.0002602] | Pa×s | [290.73; 493.17] |
Joback Predicted correlation
|
| Equation | Y = exp(A + B/T + C·ln(T) + D·T^E) Y is η in Pa×s, T in K | |||
| Coefficient A | -1.11688e+01 | |||
| Coefficient B | 1.43749e+03 | |||
| Coefficient C | 0.00000e+00 | |||
| Coefficient D | 0.00000e+00 | |||
| Coefficient E | 0.00000e+00 | |||
| Comment | Liquid phase. Joback/Reid (1987), valid from Tf to 0.7·Tc. | |||
| Temperature range, min. | 290.73 | |||
| Temperature range, max. | 493.17 | |||
| η | 0.0019806 | Pa×s | 290.73 | Calculated Property |
| η | 0.0013886 | Pa×s | 313.22 | Calculated Property |
| η | 0.0010210 | Pa×s | 335.71 | Calculated Property |
| η | 0.0007803 | Pa×s | 358.21 | Calculated Property |
| η | 0.0006156 | Pa×s | 380.70 | Calculated Property |
| η | 0.0004987 | Pa×s | 403.19 | Calculated Property |
| η | 0.0004130 | Pa×s | 425.69 | Calculated Property |
| η | 0.0003487 | Pa×s | 448.18 | Calculated Property |
| η | 0.0002991 | Pa×s | 470.67 | Calculated Property |
| η | 0.0002602 | Pa×s | 493.17 | Calculated Property |
| Property | Value | Unit | Temperature (K) | Source |
|---|---|---|---|---|
| Pvap | [1.33; 202.65] | kPa | [364.52; 521.91] |
The Yaws Handbook of Vapor Pressure
|
| Equation | ln(Y) = A + B/(T + C) Y is Pvap in kPa, T in K | |||
| Coefficient A | 1.44716e+01 | |||
| Coefficient B | -4.07036e+03 | |||
| Coefficient C | -7.75510e+01 | |||
| Temperature range, min. | 364.52 | |||
| Temperature range, max. | 521.91 | |||
| Pvap | 1.33 | kPa | 364.52 | Calculated Property |
| Pvap | 3.01 | kPa | 382.01 | Calculated Property |
| Pvap | 6.22 | kPa | 399.50 | Calculated Property |
| Pvap | 11.94 | kPa | 416.98 | Calculated Property |
| Pvap | 21.49 | kPa | 434.47 | Calculated Property |
| Pvap | 36.60 | kPa | 451.96 | Calculated Property |
| Pvap | 59.46 | kPa | 469.45 | Calculated Property |
| Pvap | 92.66 | kPa | 486.93 | Calculated Property |
| Pvap | 139.24 | kPa | 504.42 | Calculated Property |
| Pvap | 202.65 | kPa | 521.91 | Calculated Property |
| Pvap | [7.57; 67.88] | kPa | [405.36; 474.47] |
NIST
|
| Equation | ln(Y) = A + B/(T + C) Y is Pvap in kPa, T in K | |||
| Coefficient A | 1.64952e+01 | |||
| Coefficient B | -5.59697e+03 | |||
| Coefficient C | -1.85950e+01 | |||
| Reference | Dreisbach and Shrader, 1949 | |||
| Comment | Coefficents calculated by NIST from author's data. | |||
| Temperature range, min. | 405.36 | |||
| Temperature range, max. | 474.47 | |||
| Pvap | 7.57 | kPa | 405.36 | Calculated Property |
| Pvap | 10.03 | kPa | 413.04 | Calculated Property |
| Pvap | 13.15 | kPa | 420.72 | Calculated Property |
| Pvap | 17.07 | kPa | 428.40 | Calculated Property |
| Pvap | 21.95 | kPa | 436.08 | Calculated Property |
| Pvap | 27.96 | kPa | 443.75 | Calculated Property |
| Pvap | 35.32 | kPa | 451.43 | Calculated Property |
| Pvap | 44.25 | kPa | 459.11 | Calculated Property |
| Pvap | 55.01 | kPa | 466.79 | Calculated Property |
| Pvap | 67.88 | kPa | 474.47 | Calculated Property |
Similar Compounds


Find more compounds similar to 1-Propanone, 1-phenyl-.
Mixtures
- Benzene + 1-Propanone, 1-phenyl-
- Toluene + 1-Propanone, 1-phenyl-
- Benzene, ethyl- + 1-Propanone, 1-phenyl-
- Benzene, n-butyl- + 1-Propanone, 1-phenyl-
- Acetonitrile + 1-Propanone, 1-phenyl-
- 1-Propanone, 1-phenyl- + Acetamide, N-methyl-
Sources
- Jean-Claude Bradley Open Melting Point Dataset (2014, CC0) ChEDL chemicals 1.5.2, from Bradley, J.-C.; Williams, A.; Lang, A. Jean-Claude Bradley Open Melting Point Dataset. Figshare, 2014 (CC0).
- Cheméo Relay (1.0)
- Crippen Method
- (P, Vm, T) Measurements of (toluene + propiophenone) at temperatures from 298.15 K to 328.15 K and at pressures up to 40 MPa
- Excess Molar Volumes of (propiophenone + benzene, or toluene, or ethylbenzene, or butylbenzene) at temperatures 298.15 K and 328.15 K
- Density and viscosity of binary liquid systems of N-methylacetamide with aromatic ketones at T = 308.15 K
- Excess molar volumes of (propiophenone + toluene) and estimated density of liquid propiophenone below its melting temperature
- Ultrasonic studies on binary mixtures of some aromatic ketones with acetonitrile at T = 308.15 K
- Partition Coefficients of Organic Solutes between Supercritical Carbon Dioxide and Water: Experimental Measurements and Empirical Correlations
- Ultrasonic Studies of Binary Mixtures of Some Aromatic Ketones with N-Methyl-acetamide at 308.15 K
- Henry s Law Constants of Some Aromatic Aldehydes and Ketones Measured by an Internal Standard Method
- Joback Method
- Aqueous Solubility Prediction Method
- McGowan Method
- NIST Webbook
- The Yaws Handbook of Vapor Pressure
Note: Cheméo is only indexing the data, follow the source links to retrieve the latest data. The source is also providing more information like the publication year, authors and more.
Take the time to validate and double check the source of the data.
Outlier This icon means
that the value is more than 2 standard deviations away from the
property mean.
Calculated This icon marks a calculated value or equation: a prediction, not a measurement.
Compiled This icon marks a compiled value or equation: taken from a data compilation such as ChemSep, not from an original measurement report.
These property values are available through the Cheméo API. A free account gives you an access key.